 Graph Theory. In Supply Chain Management? It’s probably 10 years ago since last time I looked at Graph Theory. That was when I was writing my thesis for my MSc in GIS on Network Analysis in Raster GIS, and while I know that Graph Theory has many applications, I never expected to see it in Supply Chain Management. Now, Stephan M. Wagner and Nikrouz Neshat are using it in their 2009 paper Assessing the vulnerability of supply chains using graph theory. That is a novel approach, but does it work?
Not the first time
Honestly, I must admit, first time I came across Stephan Wagner was in Wagner & Bode (2006) An empirical investigation into supply chain vulnerability, and at that time I wasn’t really taken aback by what I read. This time, however, is very different. While I’ve always struggled with the Graph Theory Concept (I’m a qualitative much more than a quantitative thinker), and I still struggle when reading this paper, I have to give my sincere laud for developing a totally novel approach towards analyzing supply chain vulnerability.
Supply Chain Vulnerability Index
Why are supply chains more vulnerable now than before? Wagner and Neshat list four reasons:
- Disasters (man-made and natural) have increased in number and in intensity during the last decades.
I’m not sure this counts as a valid reason, but OK. - Today’s supply chains are more complex than they used to be.
Yes, no question there. - Efficiency-driven supply chain management measures have made operations leaner and more efficient in a stable environment, they also make them more prone to disruptions in an unstable environment.
True. A very valid reason. - With competition becoming fiercer, competitive pressures often force companies to assume “calculated risks”.
Has the acceptance bar been lowered too much? Perhaps.
Despite these reasons, so claim Wagner and Neshat, the understanding of the supply chain vulnerability concept still remains on a conceptual and normative level in most of the literature, so they say, and I have to concur here. That is why the main thrust of the research described in the paper is to develop a quantitative approach, were graph modeling is used to measure vulnerability using its drivers and their inter-dependencies. The result: a Supply Chain Vulnerability Index, SCVI.
Supply Chain Vulnerability Definition
While others have defined supply chain vulnerability in a succinct manner, e.g. Christopher’s “exposure to serious disturbance”, Wagner & Neshat describe supply chain vulnerability “precisely” as:
While a supply chain disruption is the trigger that leads to the occurrence of risk, it is not the sole determinant of the final loss. It seems consequential that also the susceptibility of the supply chain to the harm of this situation is of significant relevance. This leads to the concept of supply chain vulnerability. The basic premise is that supply chain characteristics are antecedents of supply chain vulnerability and impact both the probability of occurrence as well as the severity of supply chain disruptions.
Verbose, yes, but precise? Nonetheless, the definition carries within it all the necessary ingredients that need to be measured.

Supply Chain Vulnerability Drivers
Wagner and Neshat categorize supply chain vulnerability drivers (SCVD) into three groups: supply side, demand side, and supply chain structure.
Vulnerability drivers on the demand side reside in the downstream supply chain operation, including the customer (e.g., customer dependence, financial situation of the customer), the product and its characteristics (e.g., its complexity and life-cycle), the outbound supply chains (e.g., the physical distribution of products to the end-customer), the distribution and transportation operation required for serving the customer.
Vulnerability drivers on the supply side can reside in the supply base, the supplier portfolio or the supplier network (e.g., supplier-supplier relationships, supply base complexity, supply base structure).
Vulnerability drivers in the supply chain structure stem to a large degree from the disintegration of supply chains and the globalization (and off-shoring) of value-adding activities.
This encompasses the division of risk sources in Christopher (2005) and in Jüttner et al. (2003).
Supply Chain Vulnerability Levels
Wagner & Neshat contend that supply chain vulnerability exists and interconnects at many levels, something that is very reminiscent of Peck (2005) and Peck (2006). Supply chain vulnerability can be thus measured and managed at different levels:
- an entire economy
- an industry
- an entire supply chain
- the focal firm
While Peck makes her argument from the bottom up, Wagner & Neshat start from the top, indicating that this is where supply chain vulnerability has the greatest effect and where efforts to reduce vulnerability should focus on, because the firm level of analysis is narrower and fails to consider the risks stemming from a firm’s involvement in networks of production and supply.
Decision makers at these different levels are likely to have a different understanding of supply chain vulnerability. And, the higher the decision level, the more difficult it is for an individual firm to influence supply chain vulnerability.
Supply Chain Vulnerability Graphs
Graph theory may seem like a stranger to supply chain modeling, but Wagner & Neshat are not the first to apply graph theory to supply chain risk and related subjects. Faisal, Banwet & Shankar (2007) used graph theory for the quantification of risk mitigation environment of supply chains. The reason for using graph theory with supply chain vulnerability are the inter-dependencies among the supply chain vulnerability drivers .
Graphs have two basic elements: the node (or vertex) and the edge (or link). By considering vulnerability drivers as vertices and the inter-dependencies between them as edges, a graph can be plotted for a specific supply chain.
Thus, graph modeling does seem an appropriate method to quantify vulnerability and tap the inter-dependencies.
Wagner & Neshat propose that
a weighted directed graph and its adjacency matrix can be applied to calculate the SCVI. The interactions among the vulnerability drivers as considered in this article are direction-dependent and thus these interactions and their intensities are represented by a weighted directed edge.
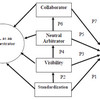
Translated into a graph and an adjacency matrix, it looks like this:

While the graph representation clearly shows variables and their inter-dependencies, the adjacency matrices can easily be stored, retrieved and processed by computer programs. Truly an ingenious approach to modeling supply chain vulnerability. The Supply Chain Vulnerability Index SCVI can be thus calculated as follows:
- Step 1: Finding graph nodes
- Step 2: Finding graph’s weighted and directed edges
- Step 3: Calculating adjacency matrix permanent
- Step 4: Comparing different SCVIs (for different risk mitigation efforts)
Implications
Wagner and Neshat even go as far as providing solid pros and cons of their method: First, the applicability of the proposed approach depends heavily on the availability of quantified data for the drivers of supply chain vulnerability. Without grounded data this method will not work. Second, the reliability of the direction of the edges in the graphs depends on expert judgment. Bias beware. Third the graph theoretical approach may not fully take into account the dynamic nature of supply chain vulnerability. Things change and graphs are perhaps too static. Fourth, while this is a novel method to measure and illustrate supply chain vulnerability, other methods are not necessarily worse suited. Humble, indeed.
Critique
Yes, this is a novel approach. I personally may still be struggling with the intricacies of graph theory, but the method is immediately attractive because of its illustrativeness. That said, the lack of quantifiable data on the interdependencies of the supply chain drivers may pose a serious hurdle in making this method generally applicable.
Reference
Wagner, S., & Neshat, N. (2009). Assessing the vulnerability of supply chains using graph theory International Journal of Production Economics 121 (6), 121-129 DOI: 10.1016/j.ijpe.2009.10.007
Author links
- linkedin.com: Stephan M. Wagner
- linkedin.com: Nikrouz Neshat
Related
- husdal.com: Book Review: Supply Chain Risk