Blog Archives

MFworks Tutorial – 03 Incremental Linkage

This operation infers the lineal characteristic of raster cells, by equating consecutive locations with a set of straight lines between them (Figure 1-3). Based on its relations with neighboring cells that have the same attribute value, each cell is given a linkage value indicating how it is linked to other cells.

Incremental Linkage, cell value infers the linear structure it represents.
© Thinkspace

By assigning a value to each cell equivalent to the linear feature it represents it is possible to create a network similar to a road network. The smaller the cell resolution, the better the real-world road network will be approximated by this procedure.

Read more

Posted in mfworks
Tags: , , ,

MFworks Tutorial – 04 Directional Identifier

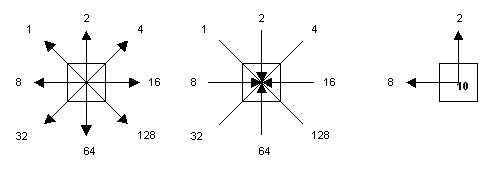
The second step to creating a road network in raster GIS is to impose constraints on the flow that can take place from cell to cell. The value assigned to the centre cell in a 3×3 window indicates the directions the flow can take in and or out of this cell. Figure 1-5 shows how a cell value of 10 is inferred from flow in direction 8 and 2.


Tomlin’s directional identifiers: Cell values indicate possible flow direction in or out of cell

The directional identifiers that are to be assigned to any given cell in a road network can be directly inferred from the Incremental Linkage values,

Read more

Posted in mfworks
Tags: , , ,

MFworks Tutorial – 05 Cost surface

Usually, to generate a cost-of passage surface, several variables will be collapsed into one layer. These variables might be road class, average speed, traffic density, and congestion during specific time of day or other factors that contribute to the overall cost variable. The cost-of-passage surface can be defined by a variety of measurement units: time, fuel consumption, money or other possible cost units, for which the least cost passage is to be determined.

Using average speed and time as a means of inferring cost-of-passage is among the most common approach in network analysis, since it is easy to use and calculate. However, “least cost” does not always need to be “least time”; it may just as well be least fuel,

Read more

Posted in mfworks
Tags: , , , ,

ARTICLES and PAPERS
Resilience X 10
Transport network resilience has 10 properties. So says Pamela Murray-Tuite in her 2006 article A Co[...]
Does product design impact supply chain risk?
Is it possible that supply chain risk is a result of unfortunate product design? Is it possible that[...]
BOOKS and BOOK CHAPTERS
One bad apple...
...spoils the barrel? Yesterday I sat down to prepare a review of this book, Managing Risks in Suppl[...]
Book review: The Network Reliability of Transport
I guess you would have to have attended the conference yourself or be a researcher in this very fiel[...]
REPORTS and WHITEPAPERS
Creating the resilient supply chain
This blog is about supply chain risk, business continuity and transport vulnerability, and while I h[...]
Global Risks 2008 - A prediction come true
In my post on Hyper-optimization and supply chain vulnerability: an invisible global risk? I highlig[...]
from HERE and THERE
Managing Supply Chain Risk
Did you know that the Supply Chain Council (SCS) has extended their renown SCOR-model  to Supply Cha[...]
Business Intelligence – a key element in Supply Chain Risk Management
In my postings on supply chain risk and supply chain disruption, there is one thing that I have ov[...]