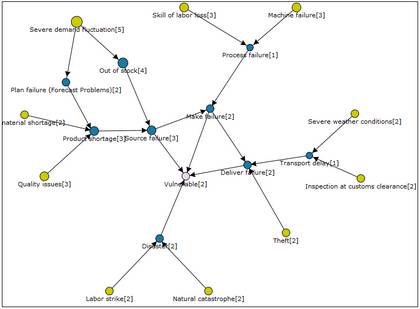
 The other day I got an email from Jan Bertrand, a Master student at the University of Technology Hamburg-Harburg, Germany, who is working on comparing tools for quantifying risks in supply networks. The reason for disruptions in supply networks is often due to a causal sequence of failure events. Therefore the causal relations of risks are modelled with a Bayesian network (Causal Network). Bertrand has established a website with a graphical model that visualizes the causal connection between risks and in an uncertain environment.
An interactive example network
The graphical model uses a Bayesian Network to determine the accumulated probability of failure in supply networks. The Bayesian network captures common causal relations of risk events in a supply chain. It is not complete and is not constructed by a proper risk assessment of a special company. However it can show where the major risks are present. In his research he uses an object oriented-approach in order to model static and dynamic interrelation between partners of a supply network.

Risks or events that are included are production failure, delivery delays, out-of stock, custom inspection, theft, strike, natural disasters and many more. The visual interface allows you to click on the nodes of the graph and estimate the individual probabilities.
Try the network here.
Evaluation
I must admit that the website is not overly intuitive in use. It took me a while to figure out how to go back and forth. That still needs some work. The accumulation of risk probabilities work very well. I think it would be interesting to develop this idea further, to the point where the risk events and the probabilities and the causal relations can be entered by the user. Then it could be very useful for practitioners looking to estimate accumulated probabilities for complex causal relations.
Related
- husdal.com: Supply Chain Risk: A Neural Network Model


