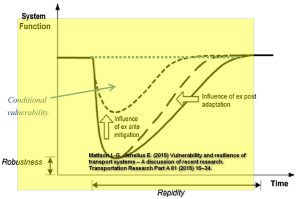
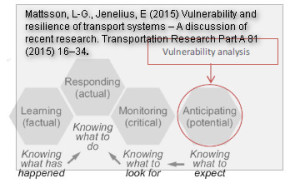
 I’ve been away from academia for the last three years, and in my efforts to catch up with the latest research in transport-related vulnerability and resilience I decided to start with the most recent papers, and track my way backwards using the references cited as a potential guideline. This paper by Lars-Göran Mattsson and Erik Jenelius on Vulnerability and resilience of transport systems – A discussion of recent research seemed like a good start. What first struck me with this paper not the extesive reference list, but a figure the authors used.
Not the first time
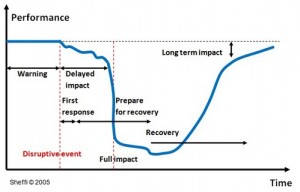
The reason why the figure struck me is that from time to time there are similar figures that appear in a number of different papers, and as a researcher I am always intrigued to find the original source and who came up with this figure in the first place. I first saw this figure it in 2007 when I reviewed Youssi Sheffi’s book The Resilient Enterprise. There they describe what they call a “disruption profile”, which looks something like this:
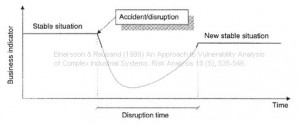
Going back in time 20 years, a very similar figure was used in Rausand and Einarssons paper from 1997 on An Approach to Vulnerability Analysis of Complex Industrial Systems, showing how an accidental event produces a consequence scenario, a disruption that tests the systems survivability:
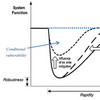
Similarly, Mattson and Jenelius use a figure they call “Effects of decision-making on resilience”, which relates to same subject, but has a different approach:
Obviously all figures address the same issue, that is the effect of disruptive events on system function (Mattson an Jenelius) or supply chain performance (Sheffi). The difference is that while Sheffi integrates mitigation and adaption in the shape of his one curve, Mattson and Jenelius specifically show how much mitigation and adaption contribute to changing how the curve bends.
So, while the principle behind the figure may not be original, the way that Mattson and Jenelius put it to use in their paper is definitely ground-breaking, because it clearly shows how mitigation can lessen the impact of an event and how resilience can be an expression of how the organisation returns to normal after an event.
Mitigation and adaptation
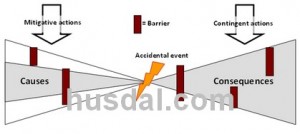
Now, mitigation and adaptation are two very intriguing concepts here. Essentially, risk management is all about mitigation, whereas adaptation lays the groundwork for resilience. In my world, where risk management is very much based on the bow-tie principle, mitigation is primarily concerned with the left side of the bow-tie, reducing the likelihood of events occurring. I called it mitigative actions and contingent actions respectively.
Mitigation, where I come from, is mostly concerned with prevention. However, as I am now gradually discovering, mitigation addresses the whole bow-tie, both the causes on the left side and the consequences on the right side. Resilience then, looks further to right of the bow-tie, and how the organisation tries to deal with the long-term impacts of an event. That is a new point of view that I hadn’t thought about, or rather, I had thought about it, but I haven’t able to put it into a figure as brilliantly as Mattsson and Jenelius have done in this paper. It appears to me now that the bow tie is only about preparedness, response, and recovery. By adding adaptation to those three we also add resilience.
First a vulnerability analysis, then resilience
The authors go on to discuss the current literature on resilience and settle for Hollnagel’s four cornerstone definition: knowing what to do, what to look for, what to expect, and what has happened. Vulnerability analysis is an important prerequisite for adequate proactive actions.
Resilience, so Hollnagel, can be defined as:
the intrinsic ability of a system to adjust its functioning prior to, during, or following changes and disturbances, so that it can sustain required operations under both expected and unexpected conditions
That is an interesting definition, because in my world, as I wrote about in my post on how road vulnerability is analysed in Norway, vulnerability is seen as
the degree of ability that an object has to withstand the effects of an (unwanted) event and to resume its original condition or function after that event.
Here the negativity of vulnerability (as in susceptibility to fail) is defined in a positive way, by saying that the better the ability to withstand, the lesser the vulnerability. So actually, my definition of vulnerability in a sense is not too far from Hollnagel’s definition of resilience. Another new discovery for me.
Conclusion
This is a very interesting paper that combines a qualitative introduction with a quantitative argumentation when it comes to exemplifying their discourse. The paper also contains a number of promising references related to resilience that I plan to discuss in a later post.
Reference
Mattsson, L-G., Jenelius, E (2015) Vulnerability and resilience of transport systems – A discussion of recent research. Transportation Research Part A 81 (2015) 16–34. DOI:10.1016/j.tra.2015.06.002
Author links:
- linkedin.com: Lars-Göran Mattsson
- linkedin.com: Erik Jenelius
Related posts
- husdal.com: Resilience Engineering in Practice
- husdal.com: A Supply Chain View of the Resilient Enterprise
- husdal.com: The resilient Enterpris
- husdal.com: Contingent versus Mitigative
- husdal.com: Road Vulnerability Analysis in Norway

