Blog Archives

MFworks Tutorial – 12 Deriving the Shortest Path

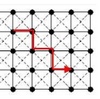
Creating proximity surfaces from origin and destination and adding them yields the shortest path.

SpreadFromStart = Spread start
To 10000.00In costoftravel
Outof direction
;

SpreadFromStop = Spread stop
To 10000.00
In costoftravel
Outof direction
;

ShortestPath_InNetwork = SpreadFromStart + SpreadFromStop
;

The shortest path is delineated by the cells with the lowest value(s). The value is the actual cost of using this path. Using the Legend function this path can be derived by changing the color of the cells with the lowest value until a continuous path from origin to detination can be seen.

Read more

Posted in mfworks
Tags: ,

MFworks Tutorial – 13 Viewing the Shortest Path

Now, the shortest path can be extracted.

ShortestPath = Recode ShortestPath_InNetwork
Assigning 999 To 262…264;

262-264 were the cell values for the shortest path. A high value of 999 was the chosen for the path to distinctively separate the path cells from any other cells in the following overlay:
The extracted path can be overlayed over the study area map for visualization.

ShortestPath_OverMap = Cover BrownsPond With ShortestPath ;

MFworks – step by step

Read more

Posted in mfworks
Tags: ,

MFworks Tutorial – 15 Shortest Path I

The procedure is similar to finding the shortest path through a network with no time-dependent travel cost (go there first).

First calculate the path(s) from origin to the cutoff-point(s), where the new time interval starts. In other words spread until the available time in time interval 1, depending on your starting time, has been used up. From the cutoff-point(s) in time interval 1, calculate the shortest path(s) to the destination through time interval 2. The path with the lowest value is the sought path. Join the paths.

The cell value at the cutoff-point for time interval 1added to the cell values of the shortest path in time interval 2 is the total cost for the joined path.

Read more

Posted in mfworks
Tags: ,

MFworks Tutorial – 16 Shortest Path II

Creating proximity surfaces for path(s) in time interval 2 and adding these together yield the shortest path(s) through time interval 2.

SpreadFromCutoff1_Time2 = Spread Cutoff_Point1
To 600
In costoftravel_time2
Outof direction
;

SpreadFromCutoff2_Time2 = Spread Cutoff_Point2
To 600
In costoftravel_time2
Outof direction
;

SpreadFromCutoff3_Time2 = Spread Cutoff_Point3
To 600
In costoftravel_time2
Outof direction
;

SpreadFromCutoff4_Time2 = Spread Cutoff_Point4
To 600
In costoftravel_time2
Outof direction
;

SpreadFromStop_Time2 = Spread stopTo 600
In costoftravel_time2
Outof direction
;

ShortestPath1_InNetwork_time2 =
SpreadFromCutoff1_Time2 + SpreadFromStop_Time2
;

ShortestPath2_InNetwork_time2
= SpreadFromCutoff2_Time2 + SpreadFromStop_Time2
;

Read more

Posted in mfworks
Tags: ,

MFworks Tutorial – 17 Shortest Path I+II

Now, the shortest path(s) can be extracted as follows:

ShortestPath_time2 = Recode ShortestPath4_InNetwork_time2
Assigning 999 To 83…85
;

For time interval 1, first add proximity surfaces, then extract path.
SpreadFromCutoff4_time1 = Spread Cutoff_Point4
To 600
In costoftravel_time1
Outof direction
;

ShortestPath_InNetwork_time1 = SpreadFromStart_Time1
+ SpreadFromCutoff4_time1
;

ShortestPath_time1 = Recode ShortestPath_InNetwork_time1
Assigning 999 To 169…171;


The extracted paths can now be joined and overlayed over the study area map for visualization.

ShortestPath_time = Cover ShortestPath_time1 With ShortestPath_time2
;

ShortestPath_OverMap_time = Cover BrownsPond With ShortestPath_time
;

Read more

Posted in mfworks
Tags: ,

Shortest Path Computation: A Comparative Analysis

Current research work into establishing a performance efficiency hierarchy between Java, C++ and ArcView is described and experimentation is performed in order to statistically compare shortest path query execution time, response time and implementation issues.

Posted in my PUBLIC PRESENCE
Tags: , , , , , , , ,

Corridor Analysis – A timeline of evolutionary development

corridor-modellingLocating a right-of-way for a linear facility such as a pipeline, a transmission line, a railway or a roadway can be a complex problem. Locating a corridor connecting an origin and a destination on a landscape is analogous to identifying a route that traverses a continuous landscape. Thus, corridor analysis is closely linked to shortest-path finding and network analysis in raster GIS, and has evolved along with it. Corridor analysis is essentially a variant of surface analysis, but can also be viewed as a site selection problem where an optimal contiguous and elongated site is sought.

My PhD?

On a sidenote, I should mention that since this post was first published,

Read more

Posted in ARTICLES and PAPERS
Tags: , , , , , ,

Fastest path problems in dynamic transportation networks

This research essay and literature review investigates some of the gateways to path finding in static and dynamic networks that are listed in present research literature. A selected set of different approaches are highlighted and set in a broader context, illustrating the various aspects of path finding in static and dynamic networks.

Posted in THIS and THAT
Tags: , , , , , , , ,

Network analysis – raster versus vector – A comparison

The key to producing successful network models is in understanding the relationship between the characteristics of physical network systems and the representation of those characteristics by the elements of the network model.

Posted in THIS and THAT
Tags: , , , , , , , ,

ARTICLES and PAPERS
Certain death: Not risky. Uncertain death: risky.
If you know for sure that things will go wrong, there really is no risk. If you don't know for sure [...]
CALL for Papers: NOFOMA 2011
NOFOMA is the network of Nordic researchers within the field of Logistics and Supply Chain Managemen[...]
BOOKS and BOOK CHAPTERS
Supply Chain Nirvana
Is there something like a Supply Chain Nirvana, where it all comes together and where a firm's suppl[...]
Book Review: This is where raster GIS started...
...well not really, but Geographic Information Systems and Cartographic Modeling by Dana Tomlin spar[...]
REPORTS and WHITEPAPERS
Global Resilience Index
The 2015 FM Global Resilience Index provides an annual ranking of 130 countries and territories acco[...]
Risk management - Vocabulary
What is risk management in supply chains? The more I study supply chain risk management, the more co[...]
from HERE and THERE
ArcView Network Analyst Tutorial
The ArcView Network Analyst (AVNA is extension module for ArcView GIS. This tutorial was developed b[...]
Managing Supply Chain Risk
Did you know that the Supply Chain Council (SCS) has extended their renown SCOR-model  to Supply Cha[...]