
After publishing 
Inbound and outbound vulnerability
2 Replies
After publishing


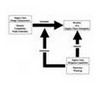

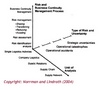


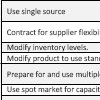
In their article, “Building a secure and resilient supply chain“, James B. Rice and Federico Caniato point at a number of actions and responses to achieve supply chain resilience.


On a sidenote, I should mention that since this post was first published, it has been mistaken for my PhD, not once, but twice…and I don’t even have a PhD yet. So much for due diligence when doing literature review. See here how to get a PhD without a dissertation. And now, back to the main topic of this post.
Locating a right-of-way for a linear facility such as a pipeline, a transmission line, a railway or a roadway can be a complex problem, both because of the input parameters that have to be evaluated and the alternatives that have to be studied. Once one good path has been identified, the task should then continue in order to identify other similarly good alternatives. Locating a corridor connecting an origin and a destination on a landscape is analogous to identifying a route that traverses a continuous landscape. Thus, corridor analysis is closely linked to shortest-path finding and network analysis. This paper will look at route finding methods in raster GIS and how corridor analysis has evolved and what the future may hold in terms of new research alleys.
Euler’s famous “Königsberg bridge” question, dating back as far as 1736, is often seen as the starting point of modern path finding – was it possible to find a path through the city of Königsberg crossing each of its seven bridges once and only once and then returning to the origin? Euler’s methods formed the basis of what is known as graph theory, and which in turn paved the way for path finding algorithms. Traditionally, network analysis, path finding and route planning have been the domain of graph theory and vector GIS, which is where most algorithms find their application. Since the objective is to find a path across a continuous surface, a raster-based GIS is usually employed in analyzing different alternatives, since it is not difficult to adapt these algorithms to a raster environment (Husdal, 2000a).
Raster applications are based on movement across a surface than movement along a network, since the general idea of finding the least cost path is linked to movement from cell to cell, and not along a finite line. However, this cell-based approach can only approximate a crisp line. Consequently, the delineation of a path across a surface in a raster GIS may very well be interpreted as a corridor rather than a confined path. Berry (2000, personal communication, in:Husdal, 2000b) prefers the term surface analysis to the term network analysis, because “It seems humans are encapsulated in their autos and effectively constrained to the line work, but most other organisms and phenomena are of the “off-road” variety and see a continuum of movement possibilities”. What this implies, is that albeit the generic structure of raster GIS facilitates an approximation and distortion of a presumably smoothly curved real-world corridor feature, it nevertheless also visualizes and draws attention to the spatial context that the least-cost path or corridor is set in.
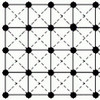
In a raster GIS cartographic space is defined as a surface, where the value of a particular property varies over this surface. In order to adapt a network or corridor structure, each cell may be seen as a node linked to its eight neighboring cells. The cell value of each node then can represent the cost of traversing this particular cell. This cost-of-passage surface is a grid where the values associated with the cells are used as weights to calculate least cost paths. These weights may represent the resistance, friction or difficulty in crossing the cell and may be expressed in terms of cost, time distance or risk (Collischonn and Pilar, 1999). Starting from a given destination cell, it is then possible to spread outward and calculate for each surrounding cell, the accumulated cost of traveling from any surrounding cell to the destination cell.
From this accumulated surface it is then possible to delineate the shortest or least-cost path to the destination cell from any surrounding cell (Douglas, 1994), simply by following the path with the least accumulated friction. In principle, when using a raster GIS, the shortest path is derived by adding the cost surface derived from a spread from an origin cell with the cost surface from a spread from a destination cell. The cells with the lowest values indicate the delineation of shortest path; the cell values indicate the actual accumulated cost of the path.
–Dijkstra
Dijkstra (1959) developed the now classic and probably most used shortest path algorithm. The most interesting feature about this algorithm is that it guarantees the optimal solution. The algorithm computes a path in all directions from the origin node and terminates when the destination has been reached. Notwithstanding the several improved algorithms and data structures for algorithms that have been put forward since, it is noteworthy that the Dijkstra algorithm has prevailed to the present date, thus proving its universal validity.
–McHarg
It seems appropriate to credit McHarg (1967) with one of the pioneering articles in corridor analysis. This was before computers invaded the field of spatial analysis, and when evaluating multiple criteria simply meant overlaying transparent maps to visualize the total impact. So it is in this case, where the least cost corridor was defined as being the area that maximizes social benefit while minimizing social cost. This method still applies today, when analysts use a GIS to overlay the similar data layers with an on-screen result, rather than transparent maps on a light table.
–Goodchild
By the mid 1970s, computers and GIS hade made their way into spatial analysis. At that time, continuous space in the real world was normally translated into a lattice or grid in computer space. As stated initially, this introduces error and approximations, particularly in regard to straight-line or smoothly curved paths. Goodchild (1977) is among the first to investigate this issue, proving that movement across a surface should not be in only orthogonal steps, but also diagonal steps to minimize elongation and deviation of the path compared to its real-world counterpart.
–Huber and Church
By addressing the geometric errors in some of the at that time current methodologies, Huber and Church (1985), paved the way for modern corridor analysis. Particularly significant is their attempt to incorporate more than just the immediately adjacent orthogonal or diagonal neighbors as candidates for spreading, but look beyond to the 15 or even 24 neighboring cells. This smoothes the delineated path and gives it a less zigzagged look. Xu and Lathrop (1995) later picked up on this, though not in terms of corridor analysis, but in looking at wildfire spread. Here, the normally circular spread is translated into an elliptical shape.
–Tomlin
Even though the concepts surrounding surface analysis for optimal paths date back as early as the late 1970s (Berry, 2000; personal communication, in: Husdal, 2000b), they were later championed by Dana Tomlin with his dissertation, which was later published as a book. Here, Tomlin (1991) classifies his map algebra operators based on how the computer algorithm obtains data values for processing and identifies three fundamental classes: local, focal and zonal functions. He introduces a spread algorithm (focal function) for calculating proximity surfaces, delineating the shortest possible distance from any location to a destination point. In this method, all cells are initialized to no value. Passes are then made through the image with each cell checking the cost of travel from each of its adjacent cells that contain a value. If the incremental effort distance is less than the difference in cumulative cost or the cell contains no value then the cell requires updating to a new value. Once a pass is completed without any changes, the cost surface has been generated (Tomlin, 1986; McIlhagga, 1997).
–Eastman
McIlhagga (1997, see below) notes that Tomlin’s method is efficient for small areas or narrow passages such as a road network; however it becomes very inefficient when large images are processed. Ronald Eastman remarks that “a 512 by 512 grid could require 700 passes” to produce a cost surface (Eastman, 1989). As part of the IDRISI GIS system, Eastman implemented a second algorithm to generate cost surfaces, called the pushbroom procedure. The [procedure operates] by pushing effects through the image, much like a pushbroom would be used to systematically clean a room. Effects then ripple through the image, much like water being pushed over a wet floor.” (Eastman, 1989). The cost surface image is initialized with no values except the target cell and a pass through the image is made from upper right to lower left with each cell updating the cell to the right and each cell below. In this manner all following cells are updated so that the most recent change is pushed forward with each successive update. Generally, three passes has been found to be enough to generate a cost surface (McIlhagga, 1997).
–Lombard and Church
Lombard and Church (1993) present what they call the gateway-shortest-path-algorithm (GSP) in an attempt not only to find the optimal path, but also at the same time support the search for good alternatives. The GSP allows for developing a sample of N-2 alternative paths for a network comprised of N nodes.
The GSP uses the Dijkstra algorithm twice, firstly spreading from origin to destination, and secondly spreading from destination to origin, the layers are then added and the path follows the cells with the lowest value. What is interesting here is that the while cell values indicate the cost to reach this particular cell from any node, the GSP algorithm also keeps track of from which neighboring cell any cell is best reached in the direction of either destination or origin. This then allows the analyst to choose any cell outside the optimal path and backtrack the path from this cell towards destination or origin and thus delineate alternative paths and alternative costs. To this authors knowledge, this method has later only appeared in Cova (2002), as a way to visualize the alternative “path-objects” that any cell may hold.
–McIlhagga
McIlhagga (1997) introduces a new term: fixed-cost distance, as opposed to the usually applied effort-distance; costs associated with effort distance are incurred every time a movement over a path occurs or more generally, movement between cells. Fixed cost distance is the cost associated with creating a path for linking multiple cells to a destination, and is incurred only once, when the path is created. Thus, minimizing effort distance involves minimizing the cost from a given point to any target (the accumulated cost surface for this given point); minimizing fixed cost distance requires finding the optimal path that connects a point to all targets regardless of minimizing the path to any of these targets in isolation (McIlhagga, 1997). Figure 3-7 gives a simple illustration McIlhagga’s fixed cost distance.
Later developed into software called “Pathways”, the core algorithm in McIlhagga’s research is an extension of Ron Eastman’s Push Algorithm applied for multiple targets. In general, the algorithm “builds” optimal cost surfaces for combinations of targets until all targets have been included. The key issue for the “Pathways” algorithm is to optimize and predict which combinations will provide the greatest contributions to a final solution.
–Collischonn and Pilar
Collischonn’s and Pilar’s concept of least-cost-paths is particularly worth mentioning, because it not merely traces a path down a cost surface, and presents the path following the least friction as the least cost path, but it links the cost of traversing the slope to the degree and direction of the slope itself. Thus, forcing a path down a steep slope may in fact be more costly than a descent that circumvents the steepest directions. This view coincides with conventional planning procedures for roads and canals, where the topography adjacent to the path plays a major role in determining the most viable route for the least cost path. Their algorithm uses a cost-slope function to assign accumulated cost to cells in 3X3 window around a center cell. The steeper the slope is, either uphill or downhill, the higher the cost will be, thus favoring directions with no or little difference in slope. As a result of this procedure, the least-cost path up or down a hill is not the straight line following the steepest path, but a path that winds or climbs the hill sideways
–Berry
Berry (2000) is not a new name to GIS or map analysis. However, he wandered into the presumably more rewarding commercial realm from academia in the late 1980s. In his Map Analysis Package, and later MapCalc, he uses a concept similar to Tomlin; he calls his algorithm “Splash” rather than “Spread”. Berry’s map operators differ from Tomlin, although they are used for the same purposes. Berry’s classification scheme is based on the user’s perspective of map input and output contents; what the map(s) look like going in and coming out: reclassify, overlay, distance and neighborhood. The Splash algorithm belongs to the distance division. For a more detailed description, see Husdal (2000).
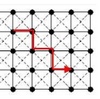
Berry also develops a concept for finding the path between multiple targets, using what he calls a stepped accumulation surface. First the optimal path is calculated from point one to point two, then from point two to point three, and further repeating the procedure for any number of points along the route (Figure 3-12). However, this procedure does not calculate the best order of points along the route; points are visited in the order they appear.
–Cowen, Jensen, Hendrix, Hodgson and Schill
Cowen et al (2000) incorporate an econometric routing model for the exploration of potential routes for a railway track, using construction cost factors such as cut and fill costs, road and river crossings, and the track cost as input parameters. Their research uses remotely sensed data, among which a high accuracy DEM derived from LIDAR, which serves to indicate that the approximations of raster GIS can be compensated by using high-resolution accurate data.
–Cova and Church
It may seem strange to mention a paper on site selection as the last in a timeline of corridor analysis, but Cova and Church (2000) point in a direction that this author is inclined to follow in his future research. Bearing in mind that a corridor can be construed as an elongated contiguous site, it does not seem to far-fetched to use the site selection analogy to find the optimal corridor. The terms of measure of goodness of fit of a corridor will course be different from a compact site, but the principle is the same.
The first and foremost dichotomy in least-cost path or corridor analysis is the age-old division between raster and vector GIS, as briefly discussed in Husdal (1999). Choosing one over the over, one will have to battle with each system’s inherent paradigms: vector as a crisp and presumably accurate delineation of linear features, raster as an approximation of both shape and length, where the distortion is determined by cell resolution and grid tessellation.
For the realm of this paper, namely raster GIS, a second paradigm can be seen in the path algorithms: Tomlin’s (1991) “spread” and Berry’s “splash” (2000) are fairly similar. Eastman’s (1987) “pushbroom” may also be included here, since all algorithms “ripple” through the image like water on a surface. Interestingly enough, these 3 different algorithms can today be found in 3 different commercial GIS: MFworks, MapCalc and Idrisi respectively, thus extending the paradigm beyond research into the user perspective.
The “gateway-shortest-path” by Lombard and Church (1993) is a Dijkstra algorithm, as is the work of Collischonn and Pillar (2000). McIlhagga (1997) diverts and uses his own algorithm, which he names “fixed-cost-distance”.
The transition from using only the orthogonal neighbors to all 8 or even beyond that was first introduced by Huber and Church (1985). Here, they showed the effect this could have on the path accuracy and thus make it less dependent on the grid structure of raster GIS, and marks yet a shift in the prevailing thought at that time. Though unrelated to corridor analysis itself, Xu and Lathrop (1995) later picked up this perspective in analyzing wildfire spread and investigated a spread algorithm with disjunct cells.
A fourth paradigm is the differentiation between path objectives. Mostly they are used to delineate a path from one origin to one destination. Lombard and Church (1993) were the first to use a second destination as a constraint along the way in order to evaluate path alternatives. McIlhagga (1997) actually solves the path for any number of destinations. Berry’s (2000) use of a step-by-step approach reaches all targets, but it may not be the overall optimal path or corridor that links these destinations.
Whereas most of the cited references discuss finding the least cost path by following the least friction from cell to cell as being equivalent to following the greatest slope on an elevation surface, Collischonn and Pillar (2000) attempt a real-world approach by implementing cost as a function of slope, such that the lesser slope is preferred and greater slope is penalized. Similarly, though not based on the preceding, Cowen et al (2000) implement engineering costs as the actual determining cost factor, leading path delineation away from it’s slope based ancestors.
Finally, Cova and Church (2000) may pave the way for a new way to look at corridor analysis, namely as a site selection problem, where the site has to include origin and destination and any other gateways, and at the same time minimize its spatial extent and maximize its suitability. In foresight, this is what this author will attempt to delve deeper into in his future research.
Berry, J., 2000, Analyzing Accumulation Surfaces, in: Map Analysis: Procedures and Applications in GIS Modeling. Berry and Associates // Spatial Information Systems Inc,
CHURCH, R., LOBAN, S., & LOMBARD, K. (1992). An interface for exploring spatial alternatives for a corridor location problem Computers & Geosciences, 18 (8), 1095-1105 DOI:10.1016/0098-3004(92)90023-K
Collischonn, W., & Pilar, J. (2000). A direction dependent least-cost-path algorithm for roads and canals International Journal of Geographical Information Science, 14 (4), 397-406 DOI:10.1080/13658810050024304
Cova, T. (2000). Exploratory spatial optimization in site search: a neighborhood operator approach Computers, Environment and Urban Systems, 24 (5), 401-419 DOI: 10.1016/S0198-9715(00)00015-6
Cova, T., & Goodchild, M. (2002). Extending geographical representation to include fields of spatial objects International Journal of Geographical Information Science, 16 (6), 509-532 DOI:10.1080/13658810210137040
Cowen, D.J., Jensen, J.R., Hendrix, C., Hodgson, M., Schill, S.R., 2000, A GIS-Assisted Rail Construction Econometric Model that Incorporates LIDAR Data. PE&RS, 66, 11, 1323-1328
Deo, N., & Pang, C. (1984). Shortest-path algorithms: Taxonomy and annotation Networks, 14(2), 275-323 DOI: 10.1002/net.3230140208
Dijkstra, E. (1959). A note on two problems in connexion with graphs Numerische Mathematik, 1 (1), 269-271 DOI: 10.1007/BF01386390
Dolan, A. and Aldous, J. ,1993, Introduction to Networks and Algorithms.
DOUGLAS, D. (1994). Least-cost Path in GIS Using an Accumulated Cost Surface and SlopelinesCartographica: The International Journal for Geographic Information and Geovisualization, 31(3), 37-51 DOI: 10.3138/D327-0323-2JUT-016M
Dreyfus, S. (1969). An Appraisal of Some Shortest-Path Algorithms Operations Research, 17 (3), 395-412 DOI: 10.1287/opre.17.3.395
Eastman, J.R., 1989, Pushbroom Algorithms for Calculating Distances in Raster Grids. Proceedings, AUTOCARTO 9, 288-297.
Goodchild, M.F., 1977, An evaluation of lattice solutions to the problem of corridor location. Environment and Planning A, 9, 7, 727-738.
Huber, D., & Church, R. (1985). Transmission Corridor Location Modeling Journal of Transportation Engineering, 111 (2) DOI: 10.1061/(ASCE)0733-947X(1985)111:2(114)
Husdal, J., 1999, Network Analysis – Raster versus Vector, A comparison study. Unpublished, coursework for the MSc in GIS, University of Leicester.
Husdal, J., 2000a, An investigation into fastest path problems in dynamic transportation networks. Unpublished, coursework for the MSc in GIS, University of Leicester.
Husdal, J., 2000b, How to make a straight line square – Network analysis in raster GIS. Unpublished, thesis for the MSc in GIS, University of Leicester.
Lee B.D., Tomlin C.D., 1997, Automate transportation corridor allocation: cartographic modeling makes it easy to determine a minimum-cost/impact alternative. GIS World 10, no.1 (1997) p. 56-58+60
Lombard, K, Church, R.L., 1993, The Gateway Shortest Path Problem: Generating Alternative Routes for a Corridor Routing Problem. Geographical Systems, 1, 25-45
Limp, F. (2000), R-E-S-P-E-C-T. A review of raster GIS systems. GeoEurope, June 2000
Malczewski, J., 1999, Multicrieria Visualization: Reorganizing Fire Protection Services. In: GIS and Multicriteria Decision Analysis, Wiley and Sons
McHarg, I, 1967, Where should Highways go?, Landscape Architecture, 57, 179-181
McIlhagga, D., 1997, Optimal path delineation to multiple targets incorporating fixed cost distance. Unpublished, Honors Thesis for Bachelor of Arts, Carleton University.
McIlhagga, D., 2000, Technological Impact on Route Planning of Optimal Solutions to the Multiple Target Access Problem. Unpublished, Slides presentation delivered at GIS 2000, Toronto, Canada, March 14th, 2000. Obtained through personal communication.
Thinkspace Inc., 2000, MFGuide. User manuals and tutorials for MFworks.
Tomlin, C. D., 1983, Digital Cartographic Modelling Techniques in Environmental Planning. Unpublished, doctoral dissertation, Yale University.
Tomlin, C.D., 1990, Geographic Information Systems and Cartographic Modelling, Prentice Hall, New Jersey
Xu, J., & Lathrop, R. (1995). Improving simulation accuracy of spread phenomena in a raster-based Geographic Information System International Journal of Geographical Information Science, 9 (2), 153-168 DOI: 10.1080/02693799508902031
Husdal, J. (2001) Corridor Analysis – A timeline of evolutionary development. Unpublished coursework. University of Utah, USA. Available online at https://husdal.com/2001/04/25/corridor-analysis-a-timeline-of-evolutionary-development/. Last accesed on [date].
![]()


