Yearly Archives: 2007

Do you know where your truck fleet is right now? No? You should.

GPS technology, such as the GPS Insight vehicle tracking system, can not only pinpoint any vehicle’s exact location, it can also transfer a wealth of detailed information about each vehicle.

Posted in THIS and THAT
Tags: , ,

Oslo airport shut-down…lessons learned?

The airline industry is a highly competitive market and even established airlines like SAS have been forced to give in low-cost carriers and reduce their own prices. But slashing ticket prices often causes slashing service too, in order to keep expenses down. However, the long-term costs of loosing passenger loyalty compared to the short-term costs of dealing with an emergency cannot be underestimated.

Posted in THIS and THAT
Tags: , , , , , ,

Book Review: The Resilient Enterprise

Excellently written, The Resilient Enterprise: Overcoming Vulnerability for Competitive Advantage does not necessarily provide concrete solutions for your own business, but it showcases how other companies, successfully or not, handled various crisis situations.

Posted in BOOKS and BOOK CHAPTERS
Tags: , , , , , ,

Why we need to think the unthinkable

To think the unthinkable, to plan for the unthinkable is maybe not what is most on people’s mind and more often than not, it is only after a crisis that our thinking shifts. Then however, it may be too late.

Posted in THIS and THAT
Tags: , , ,

Supply Chain Management – Emergency Management

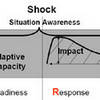
Readiness, Response and Recovery are four key elements in the New Zealand Civil Defence Emergency Management Act 2002. But how can this be related to supply chain management?

Posted in THIS and THAT
Tags: , , , , , , , , ,

MFworks Tutorial – 01 MFworks

raster-gis-mfworksThese pages will explain how to do network analysis in raster GIS using MFworks as an example software. MFworks has evolved from MAPFactory, originally designed by C. Dana Tomlin, the father of map algebra. This is unmistakably seen in MFworks command procedures and scripting language. MFworks is thus the ideal companion for teaching and learning Tomlin’s principles of map algebra. MFWorks was featured in a very positive review in the June 2000 edition of GeoEurope as the only raster GIS truly capable of network analysis. I decided to put that statment to the test.

MFworks

Conducting network analysis in MFworks comprises iterative steps that lead to a functioning network. These steps will convert map layers with square cells into linear elements that are linked together as lines,

Read more

Posted in mfworks
Tags: , , ,

MFworks Tutorial – 02 Network Modelling

The key to producing a successful network model is in understanding the relationship between the characteristics of physical network systems and the representation of those characteristics by the elements of the network model. The efficacy and validity of the network depends on how precisely the network can be modeled to match the real world network it represents. A network can be explicitly modeled in vector GIS, but can only be approximated by a raster GIS like MFworks.

Network representation in vector GIS: Nodes (numbers) and arcs (letters)

A network in vector GIS takes the form of edges (or arcs) connecting pairs of nodes (or vertices). Nodes can be junctions and edges can be segments of a road.

Read more

Posted in mfworks
Tags: ,

MFworks Tutorial – 03 Incremental Linkage

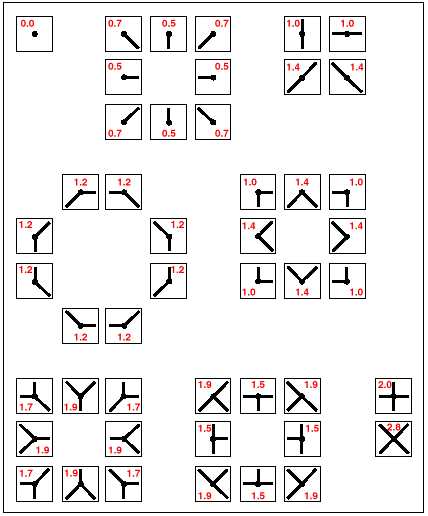
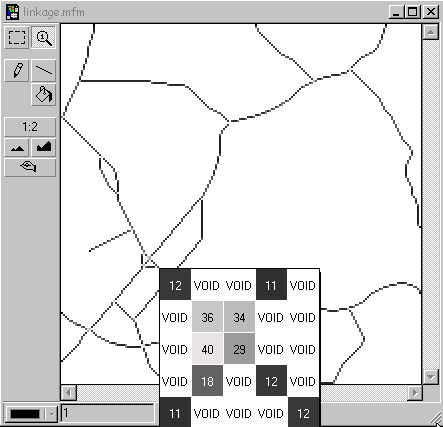
This operation infers the lineal characteristic of raster cells, by equating consecutive locations with a set of straight lines between them (Figure 1-3). Based on its relations with neighboring cells that have the same attribute value, each cell is given a linkage value indicating how it is linked to other cells.

Incremental Linkage, cell value infers the linear structure it represents.
© Thinkspace

By assigning a value to each cell equivalent to the linear feature it represents it is possible to create a network similar to a road network. The smaller the cell resolution, the better the real-world road network will be approximated by this procedure.

Read more

Posted in mfworks
Tags: , , ,

MFworks Tutorial – 04 Directional Identifier

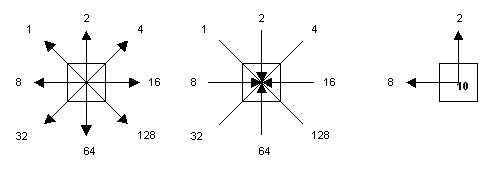
The second step to creating a road network in raster GIS is to impose constraints on the flow that can take place from cell to cell. The value assigned to the centre cell in a 3×3 window indicates the directions the flow can take in and or out of this cell. Figure 1-5 shows how a cell value of 10 is inferred from flow in direction 8 and 2.


Tomlin’s directional identifiers: Cell values indicate possible flow direction in or out of cell

The directional identifiers that are to be assigned to any given cell in a road network can be directly inferred from the Incremental Linkage values,

Read more

Posted in mfworks
Tags: , , ,

MFworks Tutorial – 05 Cost surface

Usually, to generate a cost-of passage surface, several variables will be collapsed into one layer. These variables might be road class, average speed, traffic density, and congestion during specific time of day or other factors that contribute to the overall cost variable. The cost-of-passage surface can be defined by a variety of measurement units: time, fuel consumption, money or other possible cost units, for which the least cost passage is to be determined.

Using average speed and time as a means of inferring cost-of-passage is among the most common approach in network analysis, since it is easy to use and calculate. However, “least cost” does not always need to be “least time”; it may just as well be least fuel,

Read more

Posted in mfworks
Tags: , , , ,

MFworks Tutorial – 06 Travel cost – path length

To determine the actual length of a path through a number of cells the Incremental Length operation is used. Incremental Length works similar to Incremental Linkage to the extent that Incremental Linkage is used implicitly to determine the linkage, from which the length is inferred. Incremental Length then applies the factor by which the cell resolution has to be multiplied to yield the length of the linear features in any cell.

Incremental Length cell values indicate factor for calculating length of linear features. © Thinkspace

It should be noted that Incremental Length calculates the factor for inferring the total length of all linear features in any cell.

Read more

Posted in mfworks
Tags: , ,

MFworks Tutorial – 07 Dynamic Cost Surface

One option for implementing a dynamic cost surface is to use a continuously updated network, where the latest available data at the starting time of travel is used, and where the cost of travel does not change during the duration of the estimated route. Another option is to establish a network with varying travel cost per pre-defined time interval. In this case the travel cost is dependent on the starting time of travel, and the travel cost changes when the estimated route passes from one time interval to another.

In practice, the first approach involves building an application that passes on values to the cost surface used in a raster-based GIS for calculating the fastest path in a network.

Read more

Posted in mfworks
Tags: , , ,

MFworks Tutorial – 08 Artefacts

Accuracy

Using raster GIS for network analysis leads into a simplification of a complex network structure. The path is prone to be distorted, firstly, due to the mistaken length introduced by Incremental Length, and secondly, due the zigzagged path, a consequence of the innate grid structure. Nonetheless, a fine-tuned use of Incremental Linkage and a minimal cell resolution can have a smoothing effect on the exact delineation of the path. On the other hand, minimising cell resolution increases computation.

In raster GIS the precision of the model is determined by the cell resolution, the finer the resolution (the smaller the cell size), the better the precision. For this research a cell resolution of 20m was deemed appropriate for the task in question,

Read more

Posted in mfworks
Tags: , ,

MFworks Tutorial – 09 Map Layers Needed

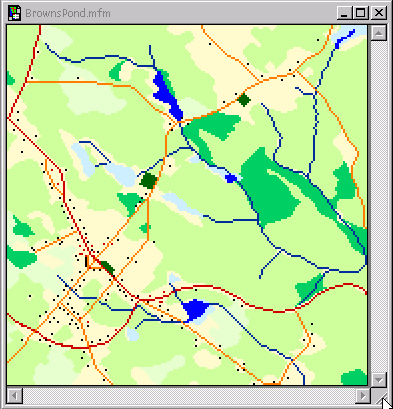
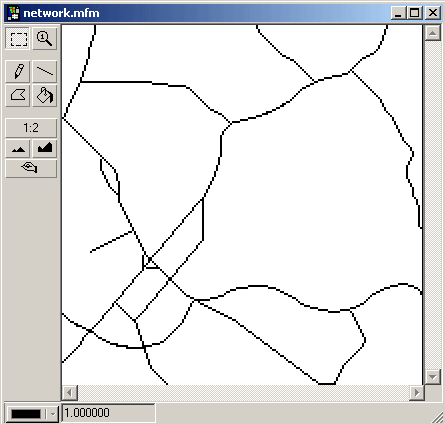
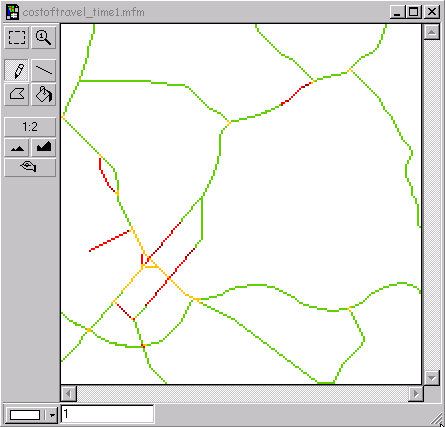
Map layers needed: A network, a cost surface, origin and destination point,

network.mfm

costoftravel.mfm

startstop.mfm

(image missing)

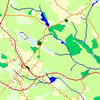
The network is a replica of the Brown’s Pond study area used by Tomlin. The cost surface are fictitious values, 1-4, indicating impedance. Origin and destination were derived by assigning the values 999 and 998 respectively to points on the network map (startstop.mfm) and then extracting each point using Recode.

MFworks – step by step

Read more

Posted in mfworks
Tags: , , , , ,

MFworks Tutorial – 10 Deriving Linkage

linkage = IncrementalLinkage network;

The Linkage operation assigns values indicating how cells are linked together.

MFworks – step by step

Read more

Posted in mfworks
Tags: , ,

MFworks Tutorial – 11 Deriving Directions

This operation converts linkage values into directional values.

direction_raw = Recode linkage

Assigning 128 to 1
Assigning 64 To 2
Assigning 32 To 3
Assigning 16To 4
Assigning 8 To 5
Assigning 4 To 6

Assigning 2 To 7
Assigning 1 To 8
Assigning 66To 9
Assigning 24 To 10
Assigning 36 To 11
Assigning 129 To 12

Assigning 48 To 13
Assigning 136 To 14
Assigning 68 To 15
Assigning 65 To 16
Assigning 130 To 17
Assigning 34 To 18

Assigning 17 To 19
Assigning 12 To 20
Assigning 80 To 21
Assigning 160 To 22
Assigning 72 To 23

Assigning 132 To 24
Assigning 33 To 25
Assigning 18 To 26
Assigning 5 To 27
Assigning 10 To 28
Assigning 138 To 29

Assigning 69 To 30
Assigning 50 To 31
Assigning 49 To 32
Assigning 140 To 33
Assigning 76 To 34
Assigning 162 To 35

Assigning 81 To 36
Assigning 164 To 37
Assigning 88 To 38
Assigning 161 To 39
Assigning 82 To 40
Assigning 74 To 41

Assigning 133 To 42
Assigning 26 To 43
Assigning 37 To 44
Assigning 90 To 45
Assigning 165 To 46
;

Read more

Posted in mfworks
Tags: , ,

MFworks Tutorial – 12 Deriving the Shortest Path

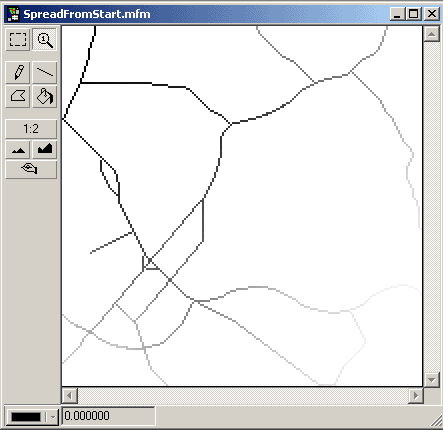
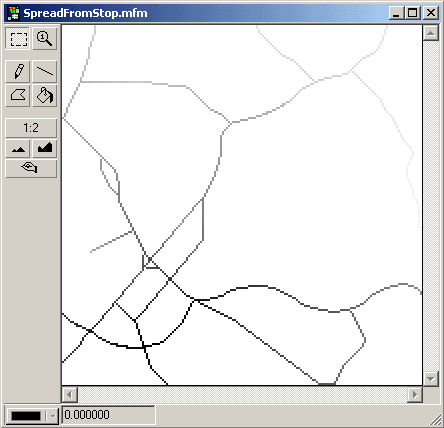
Creating proximity surfaces from origin and destination and adding them yields the shortest path.

SpreadFromStart = Spread start
To 10000.00In costoftravel
Outof direction
;

SpreadFromStop = Spread stop
To 10000.00
In costoftravel
Outof direction
;

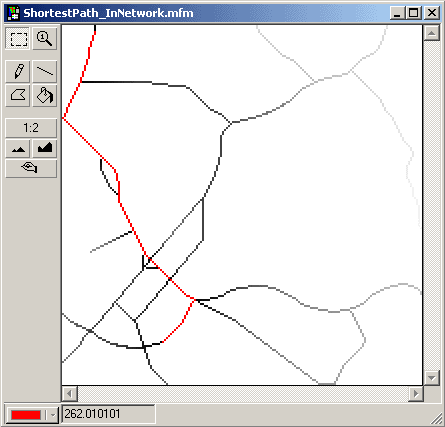
ShortestPath_InNetwork = SpreadFromStart + SpreadFromStop
;

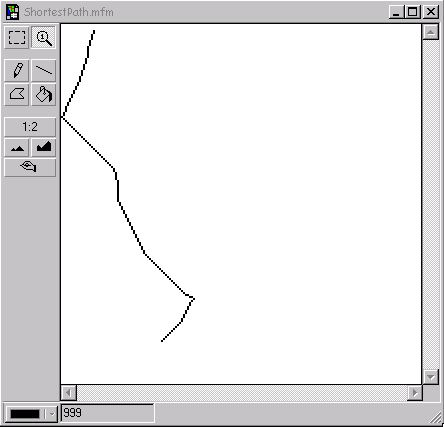
The shortest path is delineated by the cells with the lowest value(s). The value is the actual cost of using this path. Using the Legend function this path can be derived by changing the color of the cells with the lowest value until a continuous path from origin to detination can be seen.

Read more

Posted in mfworks
Tags: ,

MFworks Tutorial – 13 Viewing the Shortest Path

Now, the shortest path can be extracted.

ShortestPath = Recode ShortestPath_InNetwork
Assigning 999 To 262…264;

262-264 were the cell values for the shortest path. A high value of 999 was the chosen for the path to distinctively separate the path cells from any other cells in the following overlay:
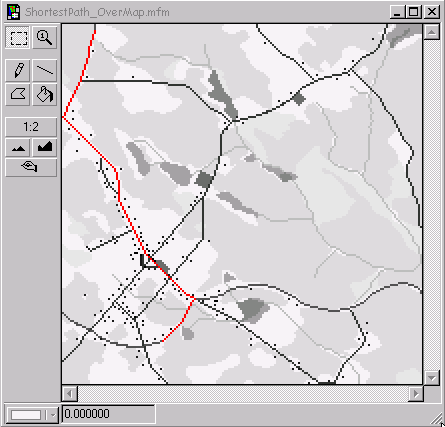
The extracted path can be overlayed over the study area map for visualization.

ShortestPath_OverMap = Cover BrownsPond With ShortestPath ;

MFworks – step by step

Read more

Posted in mfworks
Tags: ,

MFworks Tutorial – 14 Dynamic Networks

The procedure is similar to finding the shortest path through a network with no time-dependent travel cost.

First calculate the path(s) from origin to the cutoff-point(s), where the new time interval starts. In other words spread until the available time in time interval 1, depending on your starting time, has been used up. From the cutoff-point(s) in time interval 1, calculate the shortest path(s) to the destination through time interval 2. The path with the lowest value is the sought path. Join the paths.
The cell value at the cutoff-point for time interval 1added to the cell values of the shortest path in time interval 2 is the total cost for the joined path.

Read more

Posted in mfworks
Tags: ,

MFworks Tutorial – 15 Shortest Path I

The procedure is similar to finding the shortest path through a network with no time-dependent travel cost (go there first).

First calculate the path(s) from origin to the cutoff-point(s), where the new time interval starts. In other words spread until the available time in time interval 1, depending on your starting time, has been used up. From the cutoff-point(s) in time interval 1, calculate the shortest path(s) to the destination through time interval 2. The path with the lowest value is the sought path. Join the paths.

The cell value at the cutoff-point for time interval 1added to the cell values of the shortest path in time interval 2 is the total cost for the joined path.

Read more

Posted in mfworks
Tags: ,

ARTICLES and PAPERS
Community resilience in times of disaster
Can public-private partnerships improve community resilience? This question is posed in Leveraging p[...]
Supply Risk Management: just common sense?
Am I missing something here? Does Supply Risk Management come down to plain and simple common sense?[...]
BOOKS and BOOK CHAPTERS
Published. Not perished.
Publish or perish? Publish. It has taken its time, but finally it is there, the book that has my cha[...]
Book review: The Network Reliability of Transport
I guess you would have to have attended the conference yourself or be a researcher in this very fiel[...]
REPORTS and WHITEPAPERS
The UK Transport Network Resilience...and I
UK Transport Network Resilience
For a budding and even for a seasoned researcher, nothing is more rewarding than to have one's publi[...]
Vulnerable or valuable supply chain?
More than a year old now, but still holding not so few words of wisdom is the Pricewaterhouse Cooper[...]
from HERE and THERE
Economies of scale
In an article in the Norwegian newspaper Dagbladet today, some of Norways's major construction busin[...]
Migrants and European supply chains
Truckers caught up in Europe's migrant crisis say business is increasingly disrupted by queues and s[...]